A data story following trade policy from political headlines to the stock market
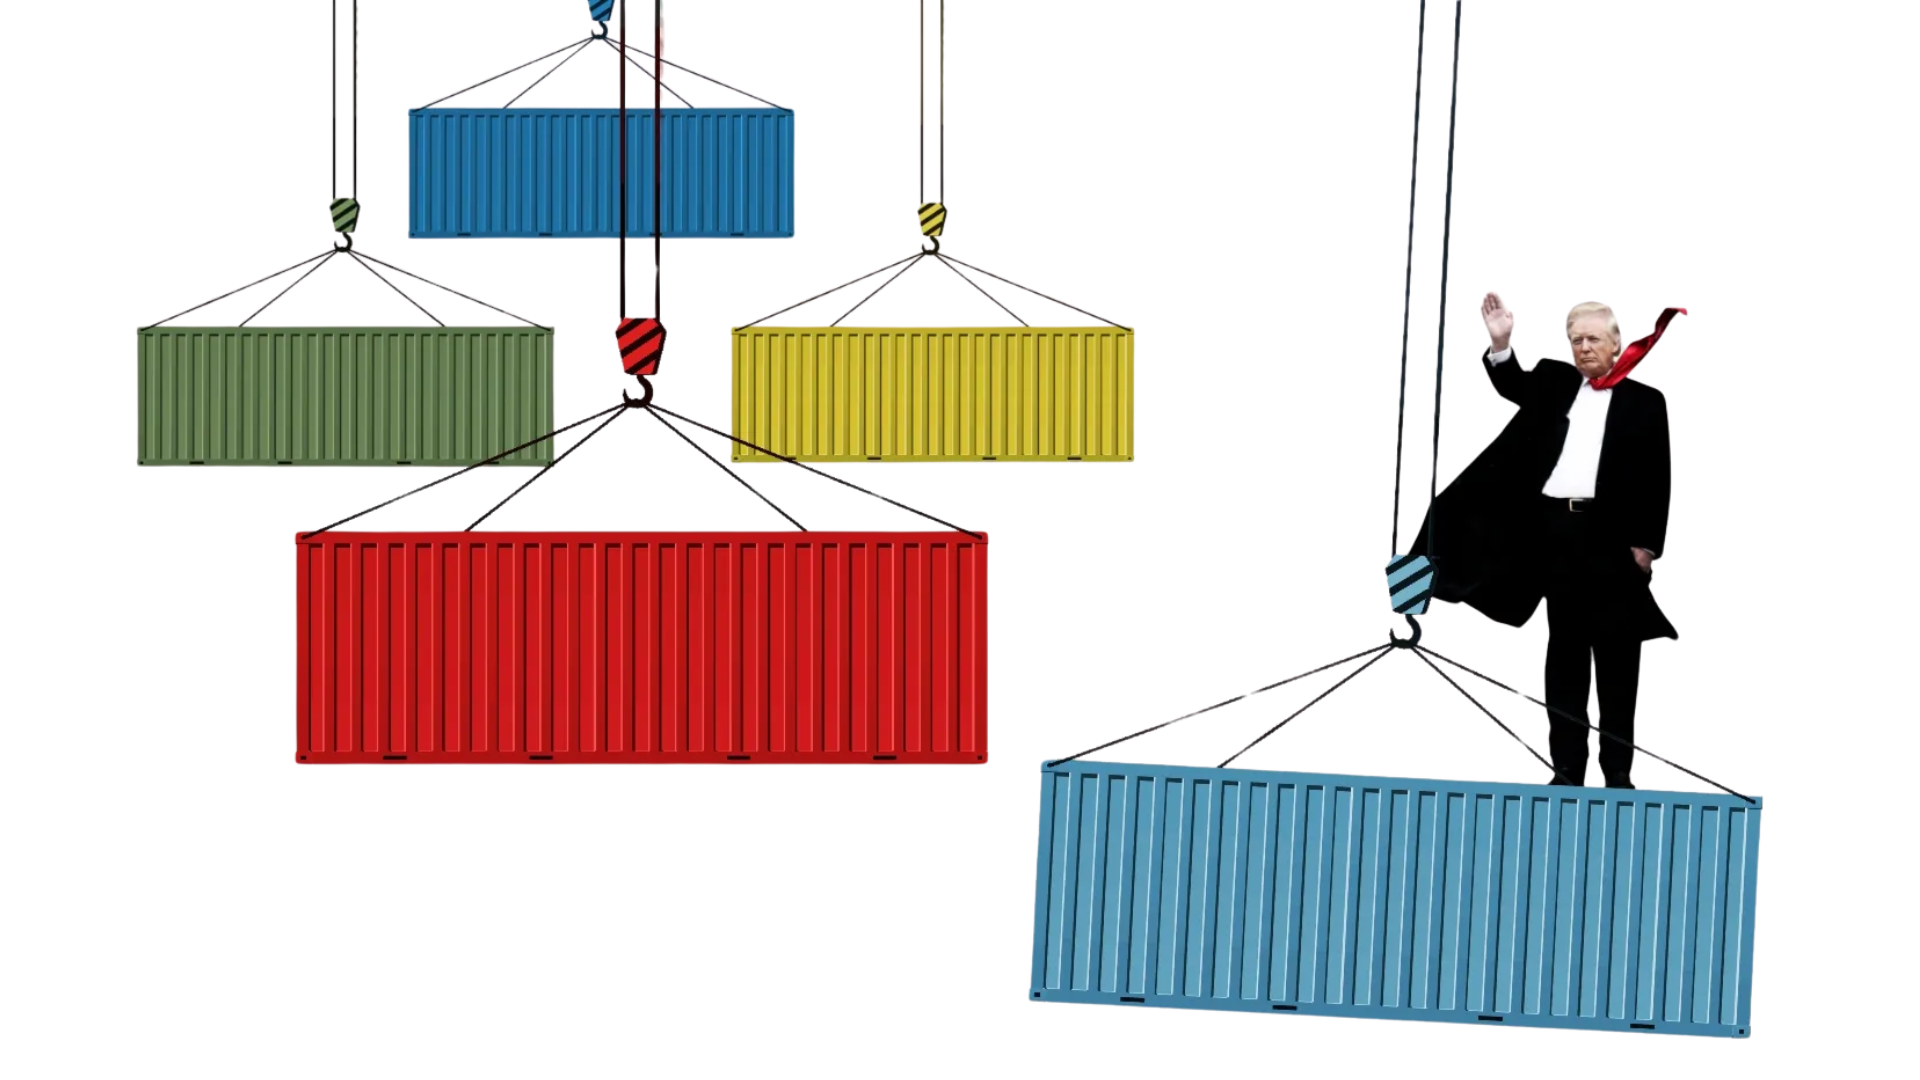
The White House called April 2, 2025, Liberation Day, the day it announced its full reciprocal tariff plan. Investors had been receiving tariff news since the start of February. Over those two months, tariffs were ordered, paused, put into effect and partly withdrawn. Each turn changed what investors knew about where trade policy was heading.
What did investors know before April 2, and what was the market doing while they learned it?
S&P 500 change, January 15 to April 1
Prices adjusted for dividends.
Mid-January
Before the first tariff announcement
The S&P 500 tracks 500 large U.S. companies, offering a broad view of the U.S. stock market. The chart begins in mid-January, before the first tariff orders arrived.
February 1
The first orders arrive
The administration ordered tariffs on imports from Canada, Mexico and China. Tariff policy stopped being hypothetical.
February 3
Two of them are paused
The Canada and Mexico measures were delayed by a month after border commitments from both governments. Investors now had a second question: whether an announced tariff would take effect at all.
February 13
A country-by-country plan is signaled
A presidential memorandum directed work on reciprocal trade, partner by partner. The shape of April 2 was visible from here.
March 4 to 6
On, then partly off
The Canada and Mexico tariffs took effect on March 4. Two days later, goods meeting USMCA rules were exempted. Escalation, then partial retreat, for the second time in five weeks.
March 26
Autos, one week out
A 25% tariff on imported vehicles and some parts was announced, to take effect April 3. The reciprocal package was still unknown.
April 1
The full picture was still missing
Two months of tariff news were already public. What investors had not seen was the full reciprocal structure, and that arrived after the close on April 2.
The April 2 order set an additional 10% baseline tariff on nearly all imports, with higher country-specific rates for dozens of trading partners.
Hover or tap a country to see its tariff rate. When zoomed in, drag to move around the map. Use the buttons to zoom out or reset.
Antarctica and the French Southern Territories are left off the map because there is no trade and no rate to show. Countries in light gray are left out of the April 2 order because sanctions and existing Column 2 rates already apply.
The highest rates went to Lesotho at 50%, Cambodia at 49% and Laos at 48%.
The same countries, moved out of their places on the map and set by how much they trade with the United States against the rate they were assigned.
Hover or tap any dot for its figures.
Trade volume shown on a logarithmic scale to accommodate differences in magnitude across trading partners.
The four largest relationships, the European Union, Mexico, Canada and China, sat between 20% and 34%.
ETFs are funds that hold baskets of stocks and trade under short codes called tickers . Each card shows a fund's three largest holdings. Tap it to see why that part of the market is worth watching.
Fund change, March 26 to April 9
Hover or tap the chart to see each fund's change over time.
Use the buttons below to show or hide fund lines.
Back to the market
SPY tracks the S&P 500, providing a baseline for the sectors that follow. Each fund's change is measured from its March 26 closing price.
The reciprocal order arrived after the regular market close on April 2. The first full trading session after the announcement was April 3.
The first full session came April 3
SPY fell 4.9% that day, followed by another 5.9% decline on April 4.
The decline wasn't evenly distributed
Semiconductors, industrials, materials and consumer discretionary each connect to the wider economy in their own way: chips that can cross borders several times, factories that source parts abroad, raw materials upstream of everything else, and purchases households can put off.
By April 8, all four were further below their March 26 level than SPY, industrials only slightly.
Staples held up better
Consumer staples, the food and household basics people tend to keep buying, was down 4.4% at the April 8 close. Semiconductors were down 22.0%.
And then the policy changed again
On April 9 the administration announced a 90-day suspension of the higher country-specific rates for most trading partners. The additional 10% baseline stayed, and China was treated separately, with its rate raised.
The announcement was followed by a sharp reversal in the same session. Every line on this chart turned upward, SPY by 10.5%.
A stock price reflects what investors expect a company to earn, so it can move long before a policy reaches anyone's financial statements. By April 2, investors had already received two months of tariff announcements, delays, exemptions and signals. The full package was followed by two days of steep losses, and the pause a week later by a sharp reversal in a single session.
Tariffs weren't the only thing moving markets. Earnings, interest rates and other economic forces were changing at the same time. The charts place policy news and prices side by side, but they don't prove that tariff announcements alone moved those prices. Liberation Day was one day. The market had been trading it for months.